
Local Dashboard
Inspect BlazeRules runtime activity from decision logs, agent statistics, ruleset files, dead-letter logs, and optional Prometheus metrics.
blazerules_dashboard is a read-only local observability server. It watches
decision outputs, agent statistics, rulesets, dead-letter logs, and optional
Prometheus metrics without participating in evaluation.
Standalone executableThe dashboard is provided by
blazerules_dashboard. The mainblazerules
CLI has nodashboardsubcommand, and the Python module has no dashboard
server API.
Run the dashboard
blazerules_dashboard \
  --host 127.0.0.1 \
  --port 9470 \
  --rules rules.yaml \
  --decision-log decisions.arrow \
  --dead-letter-log dead_letters.ndjson
For multiple agent instances, point the dashboard at the output and ruleset
directories:
blazerules_dashboard \
  --host 127.0.0.1 \
  --port 9470 \
  --decision-log-dir logs/ \
  --rules-dir rulesets/
Open http://127.0.0.1:9470 after the server starts. The order in which the
agent and dashboard start does not matter. The dashboard discovers new files
and resets source state when watched files are removed or replaced.
Overview
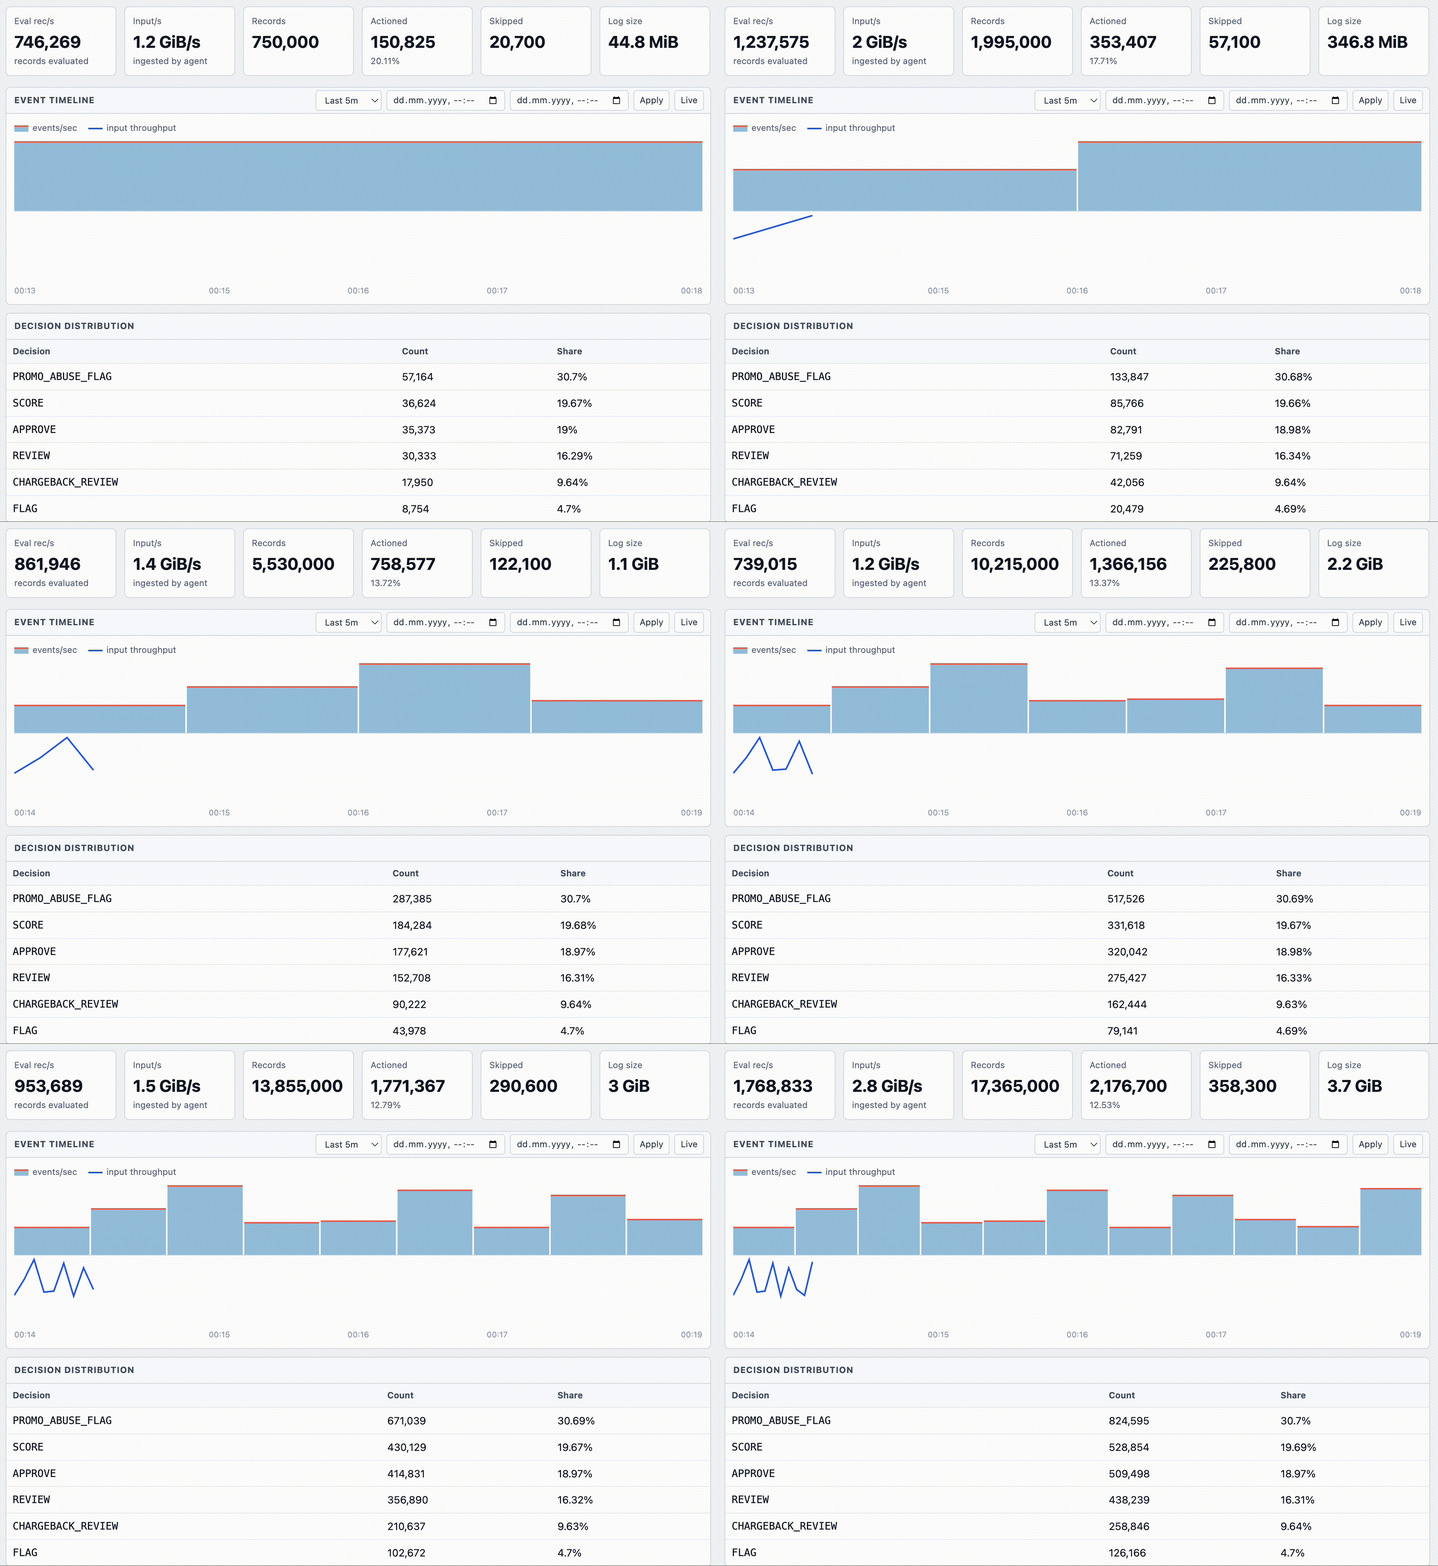
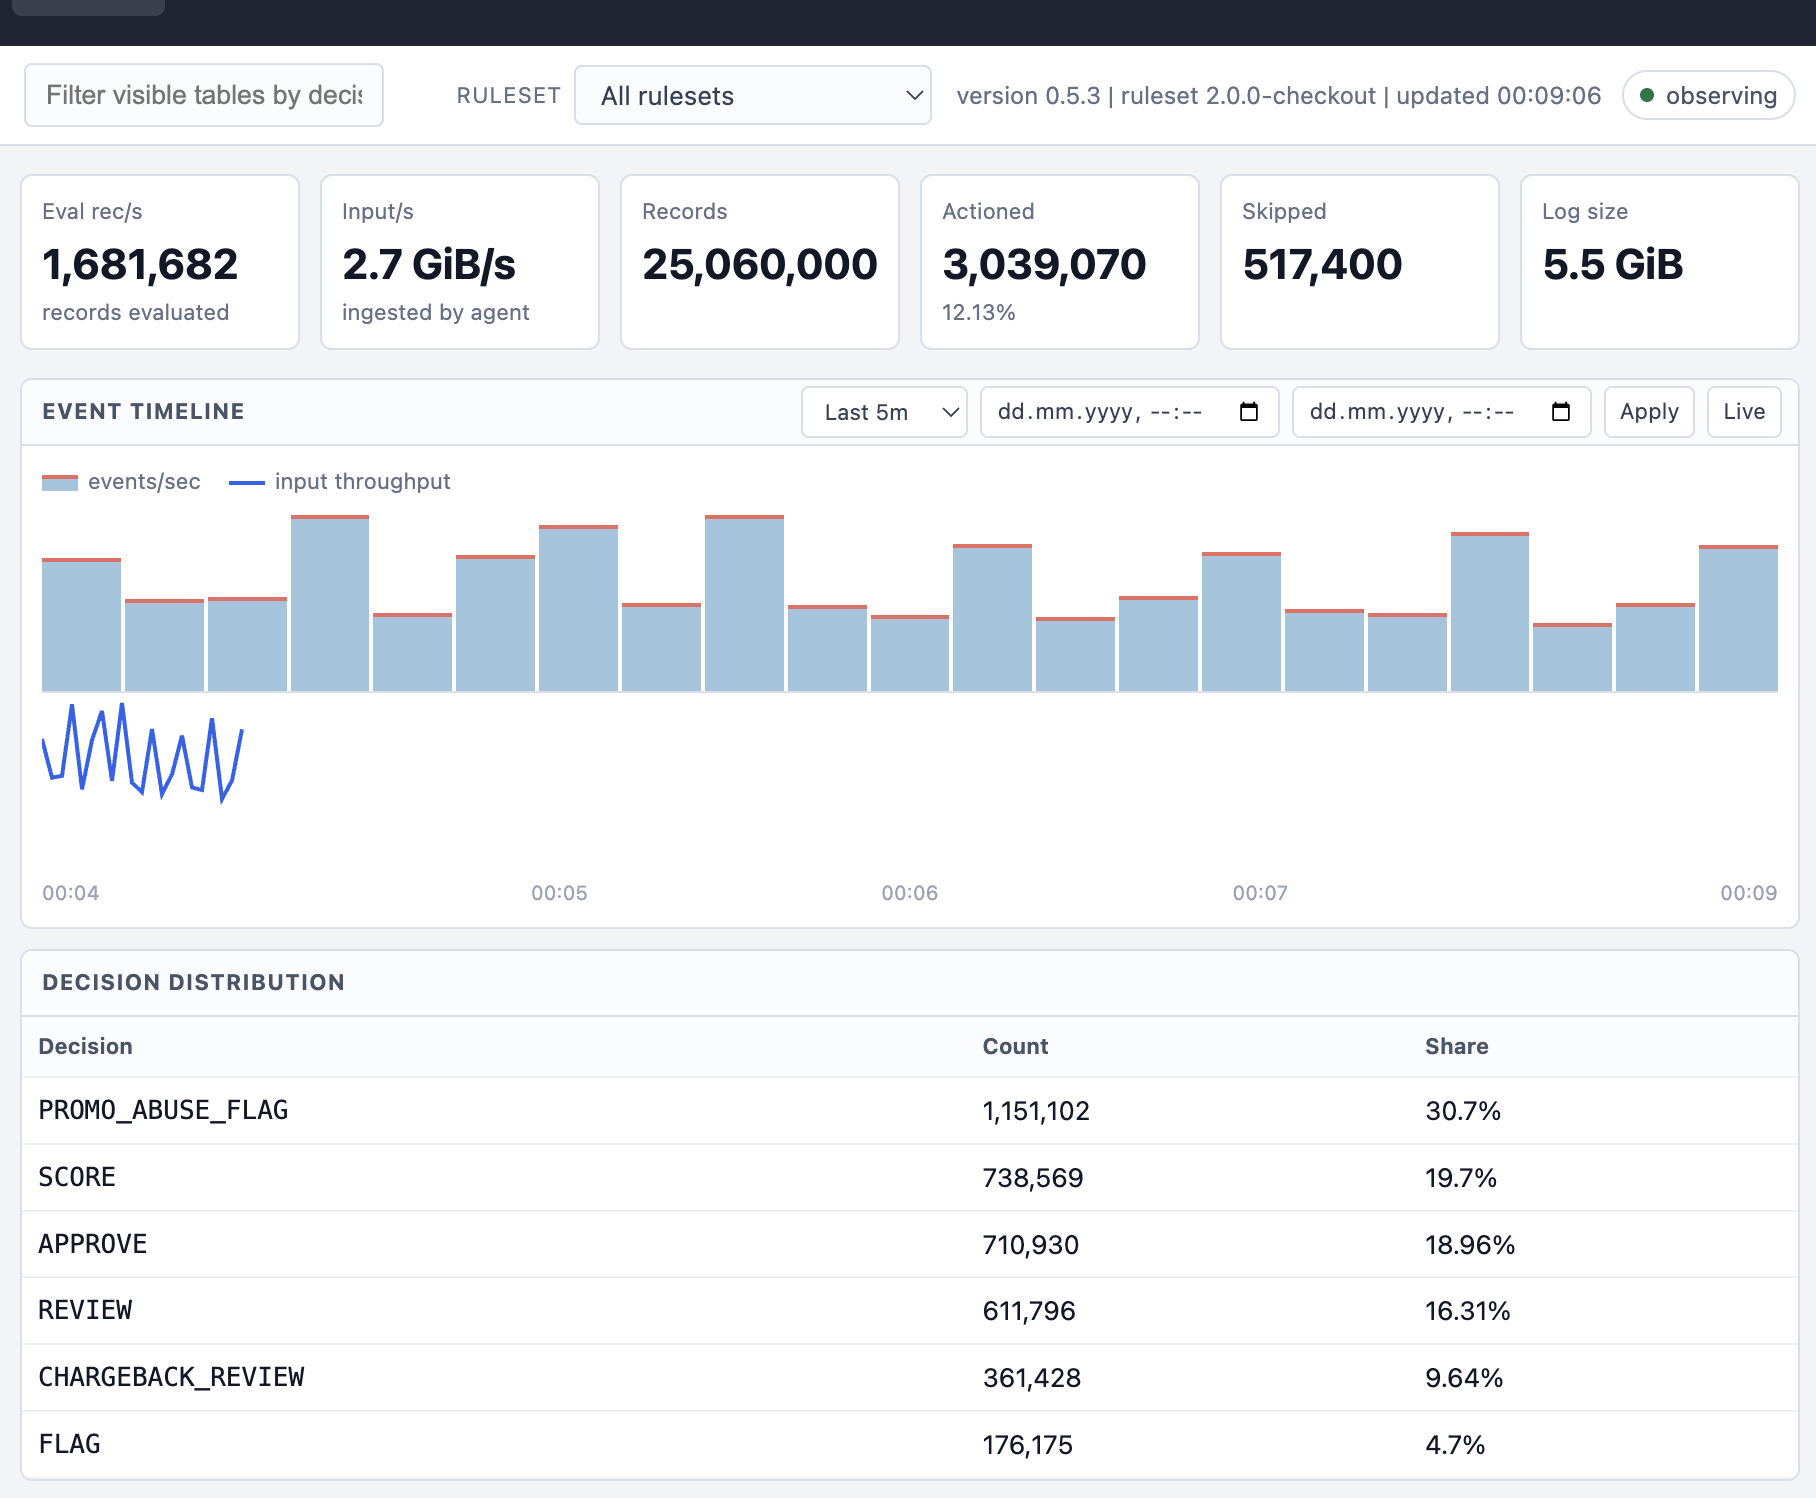
The Overview page summarizes the selected ruleset or all discovered rulesets.
It displays:
- current evaluated records per second and input bytes per second from agent
.statssidecars; - cumulative records, actioned records, skipped records, and decision-log size;
- a time-bucketed event and input-throughput chart;
- decision distribution, instance share, latency metrics when configured, and
recent winning rules.
The time selector supports live ranges and explicit start/end timestamps. Long
ranges are aggregated into bounded buckets before rendering.
Event Timeline
The Event Timeline page provides indexed access to recent decision records.
Filters include instance, decision, risk band, winning rule, free text, and time
range. Results are paginated instead of transferring the full decision log to
the browser.
The in-memory index stores timestamp, score, decision, risk band, rule,
ruleset, instance, and model outputs. String dimensions are dictionary encoded.
The index retains at most --max-index-rows rows.
Rule Fire Rates
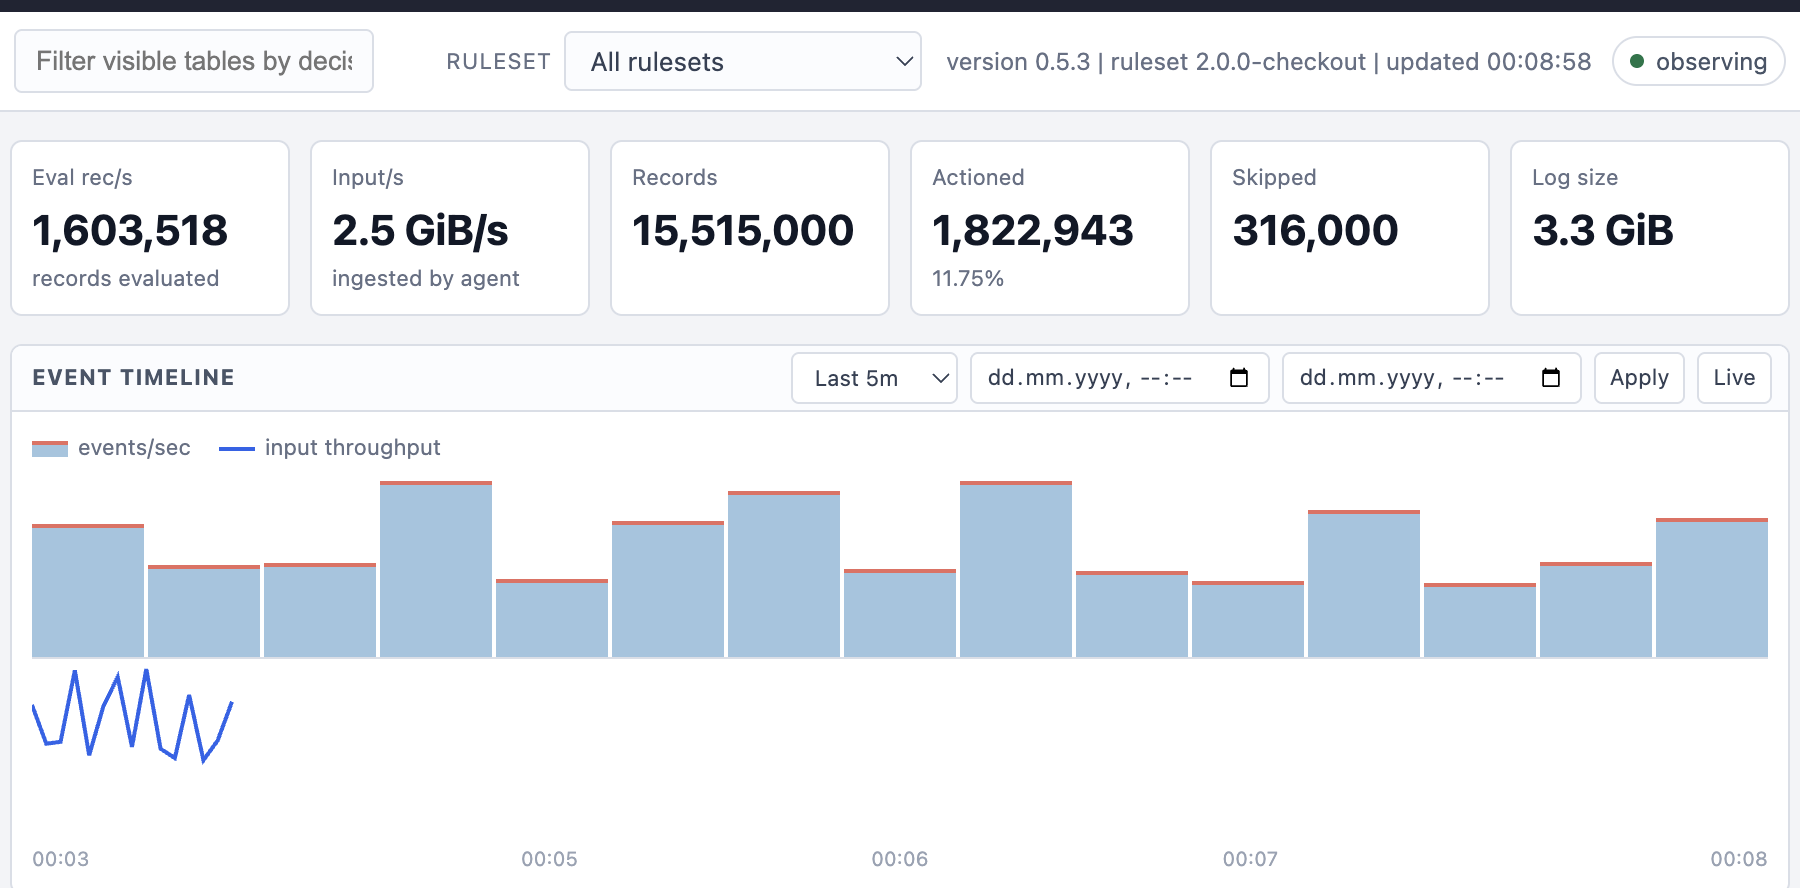
The Rule Fire Rates page combines cumulative per-rule metrics with recent
winning-rule counts. It identifies rules that fire frequently, rules that never
fire, and rules that dominate the final decision after precedence reduction.
Detailed fire totals require engine metrics. Winning-rule counts remain
available from decision logs even when a Prometheus endpoint is not configured.
Models
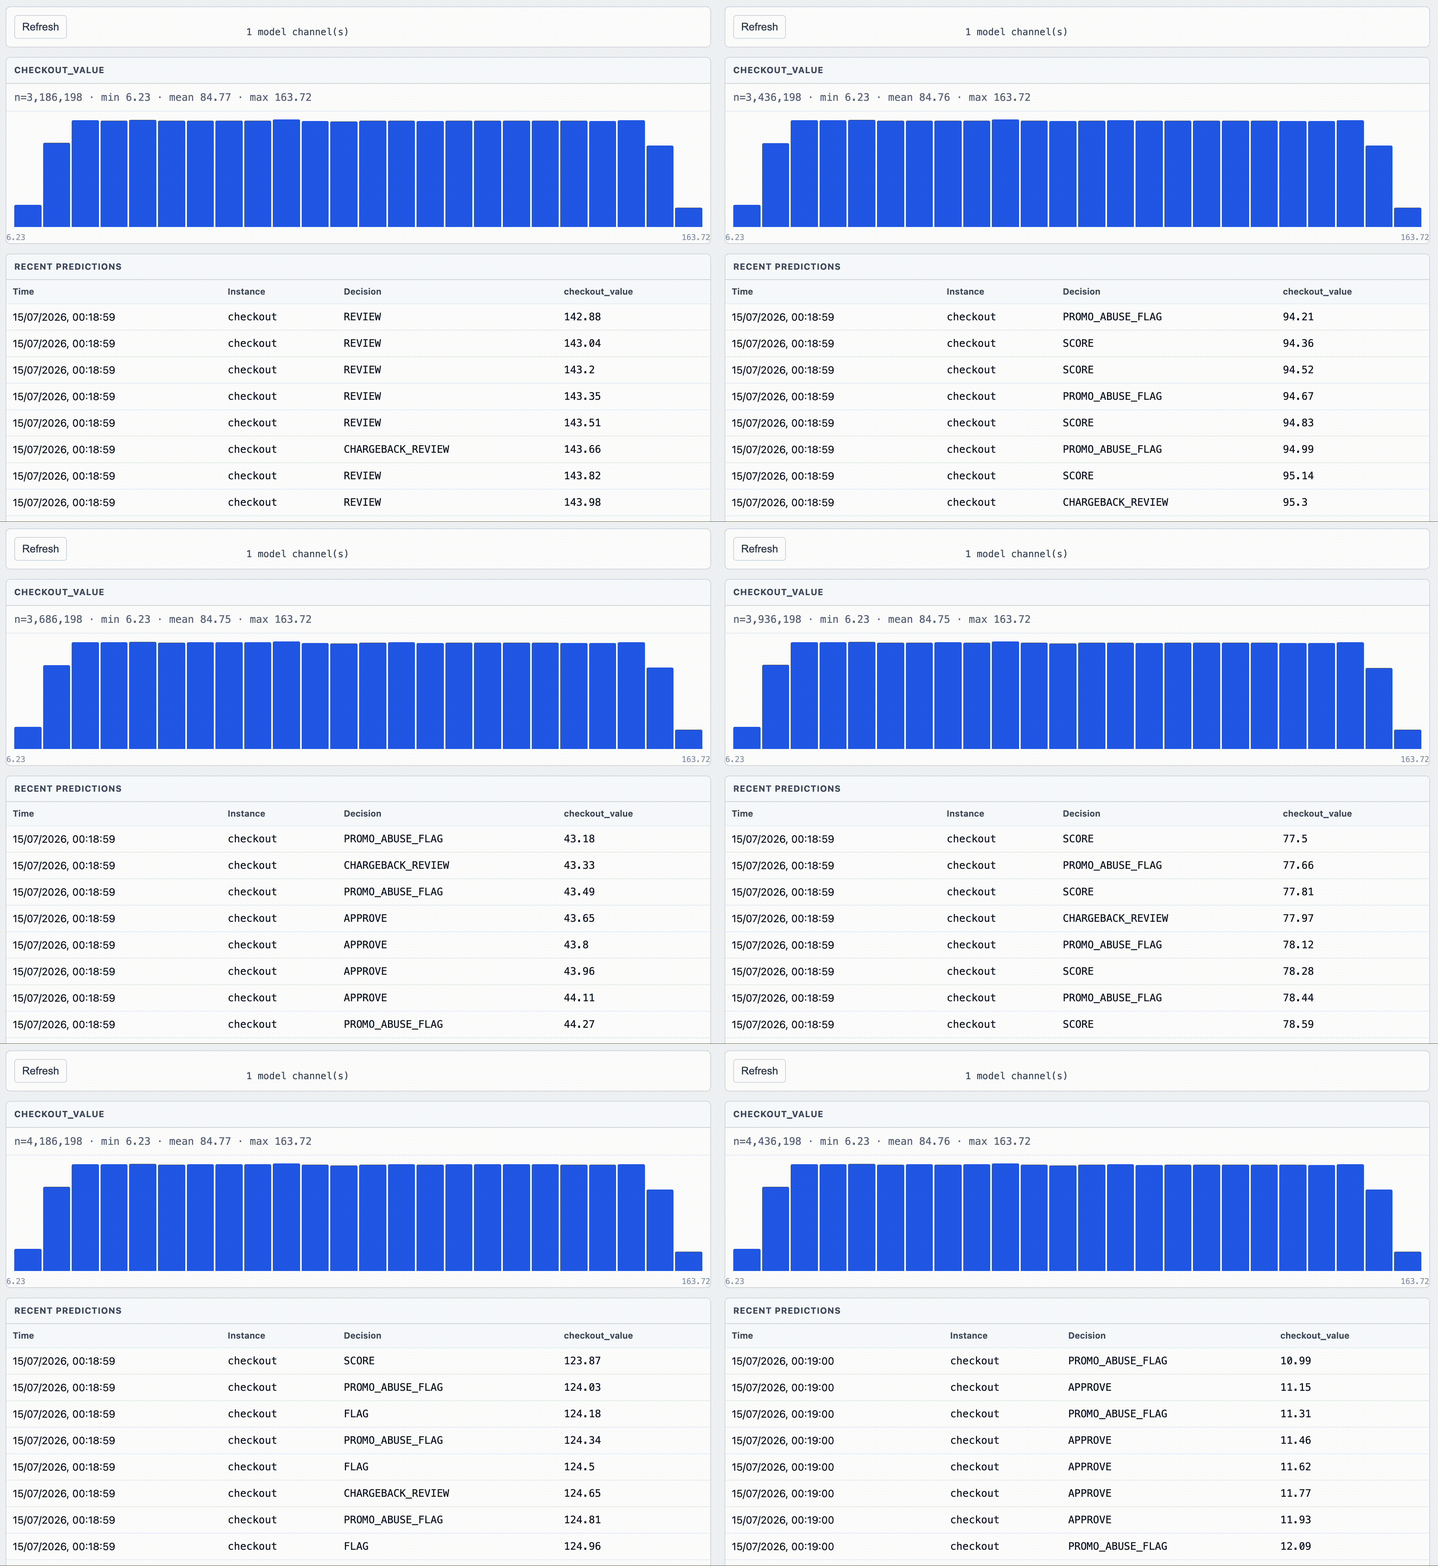
The Models page reads raw model channels written by rules using model_score.
Each channel has a prediction histogram, count, minimum, mean, maximum, and a
recent prediction table joined to decisions and instances.
The agent writes model outputs as model.<name> Arrow columns or as the
model_scores object in NDJSON. The dashboard creates one panel per discovered
channel and applies the active ruleset filter to every panel.
Ruleset Visualizer
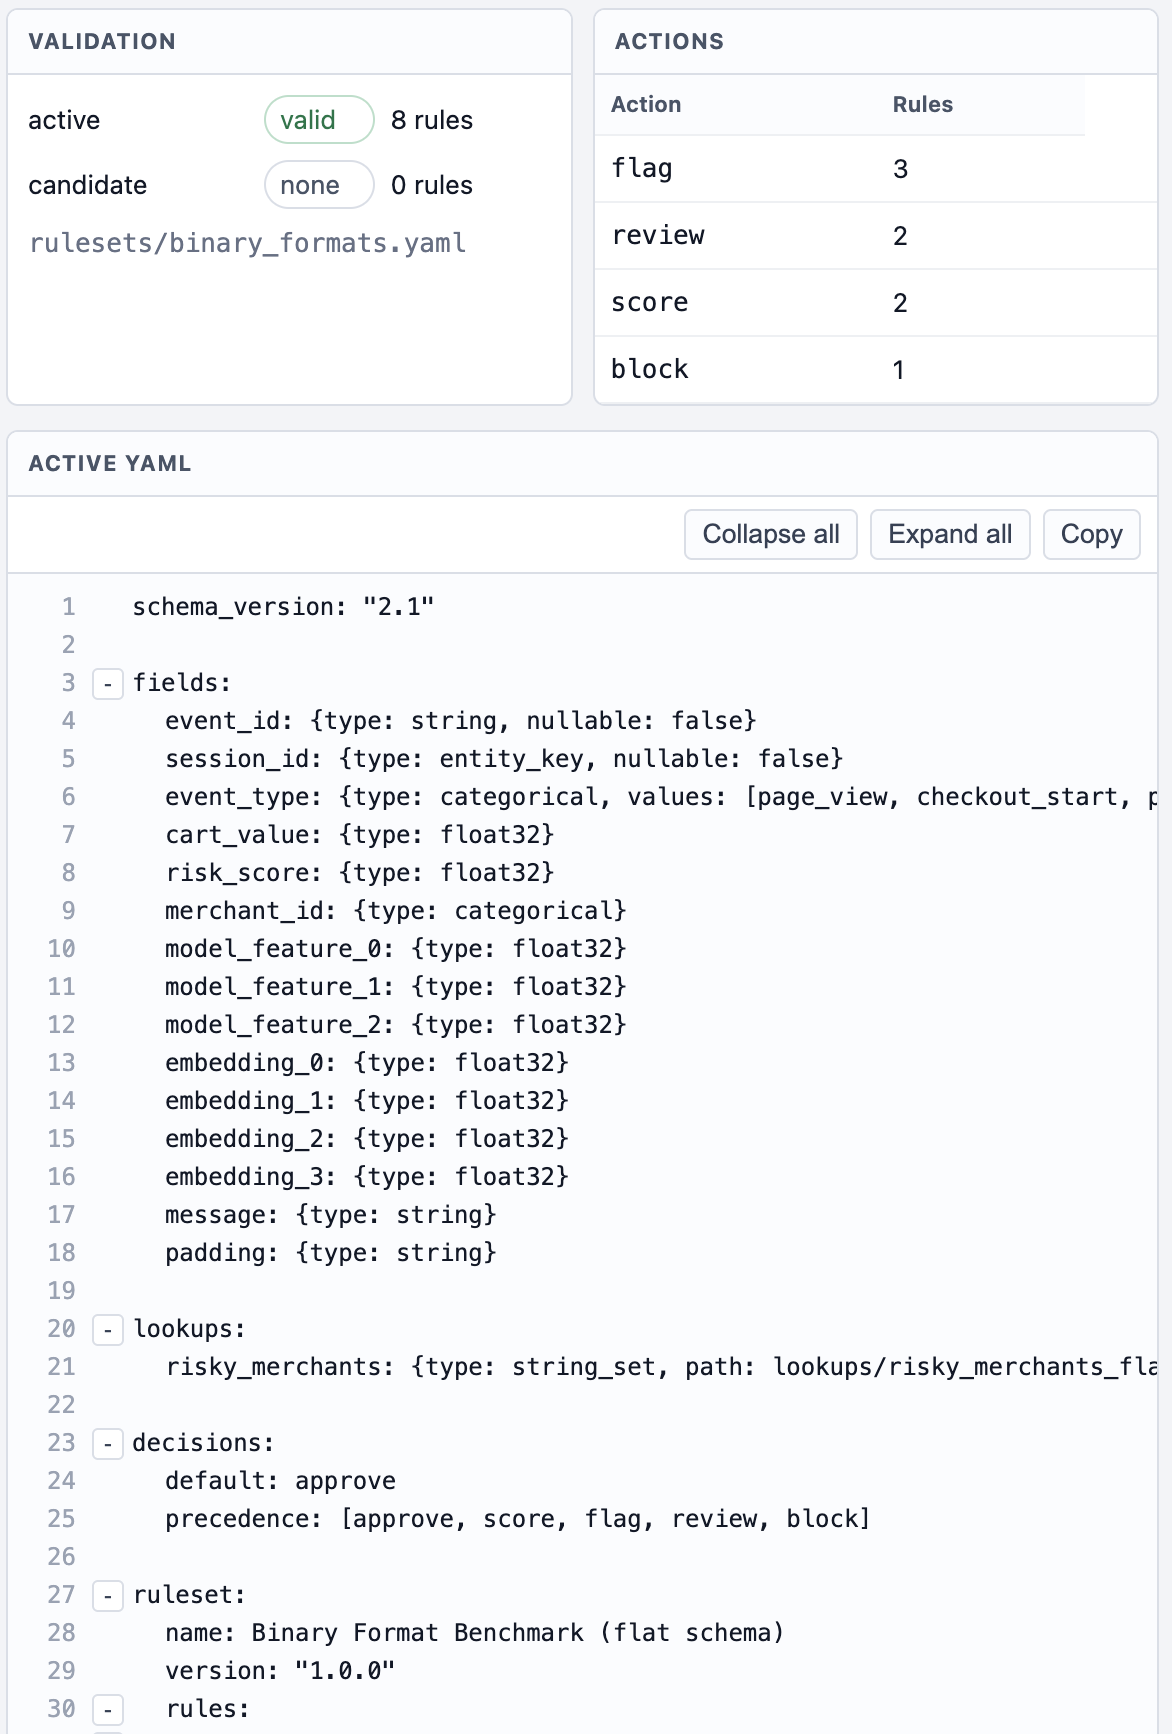
The Ruleset Visualizer parses the active YAML and presents validation state,
decision actions, operator distribution, and collapsible YAML sections. With
--candidate-rules, it also displays the active-to-candidate diff. With
--rules-history-dir, it lists prior YAML revisions available on disk.
--rules-dir maps ruleset file stems to agent instance names. For example,
rulesets/checkout.yaml is selected with decision rows whose instance is
checkout.
Errors / DLQ
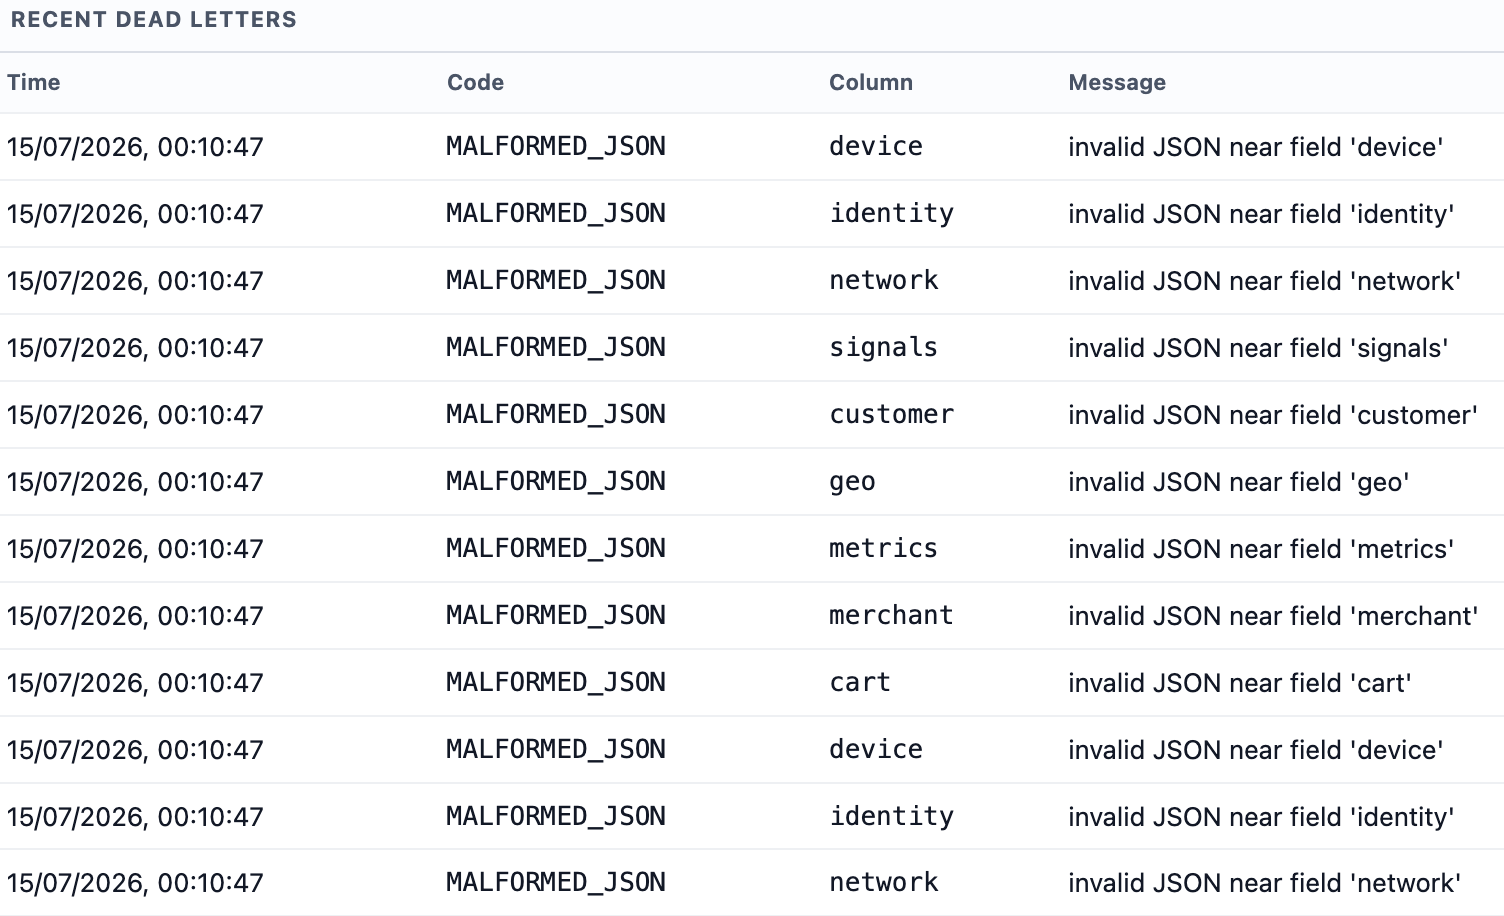
The Errors / DLQ page aggregates error codes and displays recent dead-letter
records. The dashboard discovers files containing dlq or dead_letter when
--decision-log-dir is configured, or reads the explicit
--dead-letter-log path.
Dead-letter rows remain separate from decision rows. The page reports the
record timestamp, error code, column, and compact error message without showing
the complete source payload by default.
System
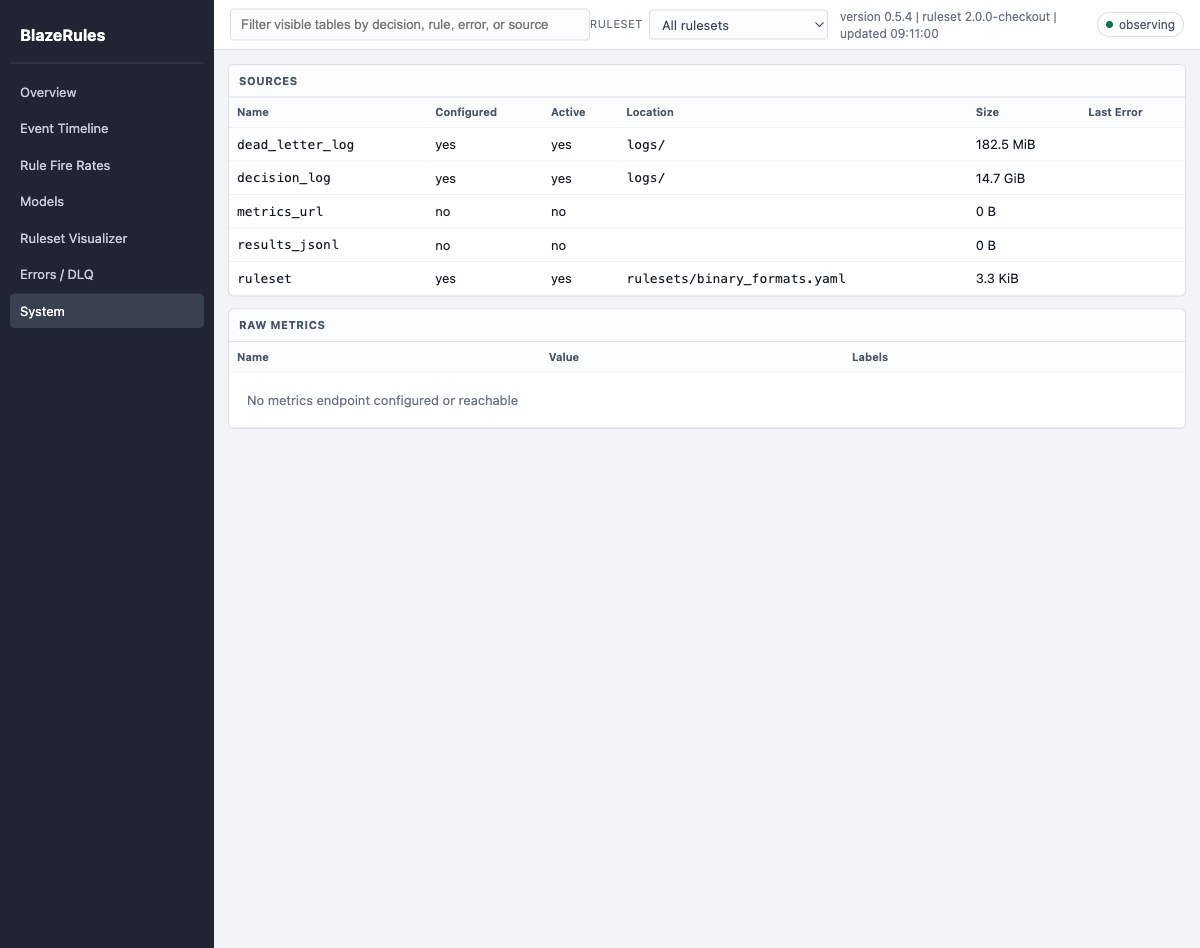
The System page lists every configured source, its resolved location, active
state, normalized size, and last read error. It also exposes raw Prometheus
series when --metrics-url is configured.
This page is the first diagnostic point when a dashboard panel is empty. A
source marked inactive indicates a missing file, inaccessible S3 object,
unreachable metrics endpoint, or unsupported content.
Decision-log indexing
NDJSON and Arrow IPC decision logs feed the same columnar index. Arrow output
usually uses less disk and avoids reparsing JSON. The index keeps the newest
--max-index-rows decisions; /api/decisions reports indexed_rows and
truncated when the configured limit excludes older rows.
When a directory is watched, .stats sidecars provide input rate, input bytes
per second, evaluated rows per second, output bytes per second, and skipped-row
counters without rescanning a large decision file. Decision and dead-letter
files may also be read from s3:// objects or prefixes.
Command-line reference
| Flag | Default | Purpose |
|---|---|---|
--host | 127.0.0.1 | HTTP bind address. |
--port | 9470 | HTTP port. |
--poll-ms | 1000 | Source polling interval. |
--tail-lines | 5000 | Recent decision and dead-letter rows retained for tail views. |
--max-index-rows | 5000000 | Maximum decision rows retained in the filter index. |
--decision-log | empty | One NDJSON or Arrow IPC decision log; local path or S3 object. |
--decision-log-dir | empty | Directory or S3 prefix containing per-instance decision logs. |
--dead-letter-log | empty | Dead-letter NDJSON path. |
--metrics-url | empty | Prometheus exposition endpoint. |
--results-jsonl | empty | Stress-result JSONL source. |
--rules | empty | One active ruleset for the visualizer. |
--rules-dir | empty | Directory or S3 prefix containing per-instance rulesets. |
--candidate-rules | empty | Candidate ruleset used for validation and diff. |
--rules-history-dir | empty | Directory containing prior ruleset revisions. |
--aws-region | environment | AWS region used for S3 sources. |
--aws-endpoint-url | environment | Custom S3-compatible endpoint. |
--version | — | Print the version and exit. |
-h, --help | — | Print usage and exit. |
Read-only HTTP endpoints
| Endpoint | Returns |
|---|---|
/api/health | Liveness, configured sources, and source errors. |
/api/summary?instance= | Counts and decision/risk distributions. |
/api/metrics | Latest Prometheus series. |
/api/decisions?limit=N | Indexed decision rows with instance, decision, risk, rule, and time filters. |
/api/models?bins=N&instance= | Model histograms and summary statistics. |
/api/errors?limit=N | Error counts and recent dead-letter rows. |
/api/rules?limit=N&instance= | Rule fire and winning totals. |
/api/ruleset | Active ruleset metadata and visualizer data. |
/api/benchmarks | Rows loaded from --results-jsonl. |
All endpoints use GET and return JSON.
Local access onlyThe dashboard has no authentication or TLS termination. The default bind is
127.0.0.1. Network exposure requires an authenticated reverse proxy or
private tunnel.
Related pages
Updated 3 months ago